Characterization of N-CDs
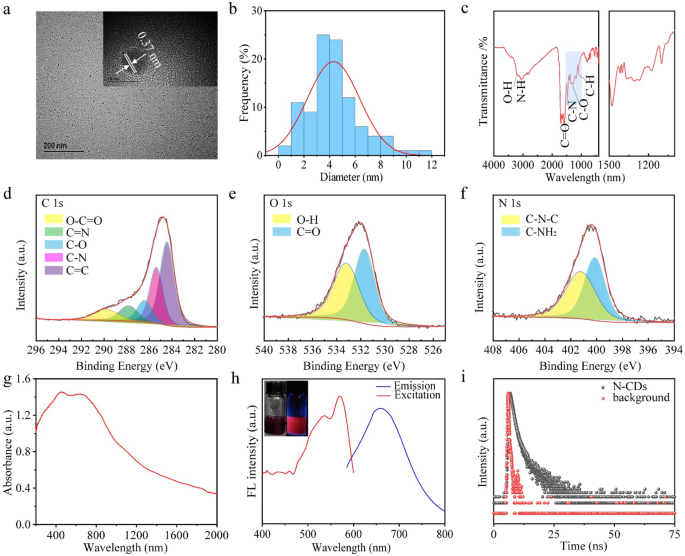
The transmission electron microscopy (TEM) image of N-CDs (Fig. 2a) reveals spherical zero-dimensional structures, with the high-resolution TEM image (Fig. 2a inset) demonstrating a lattice structure with an interplanar spacing of about 0.37 nm. This spacing aligns with d-spacing of the graphitic carbon (002) lattice plane [36]. Analysis in Fig. 2b indicates that the average particle size of N-CDs is about 4.8 nm. The X-ray diffraction (XRD) pattern (Fig. S1) exhibits a distinct peak at roughly 27°, corresponding to the typical (002) diffraction of graphitic carbon, indicative of a crystalline, layered structure similar to graphene. The XRD data confirm a well-defined graphitic structure, consistent with previous reports on N-doped CDs, where graphitic nitrogen doping induces shifts in absorption and emission spectra [37]. Specifically, graphitic nitrogen narrows the energy gap between the highest occupied molecular orbital (HOMO) and the lowest unoccupied molecular orbital (LUMO), leading to a red shift in the spectral response [12].
In the Fourier transform infrared (FT-IR) spectra (Fig. 2c), the absorption peaks at 3209 and 3080 cm− 1 for N-CDs correspond to O-H and N-H groups, respectively [37]. The peak at 1580 cm− 1 is attributed to C = O absorption, while the peak at 1477 cm− 1 arises from the asymmetric stretching vibration of C-N. Additionally, the absorption peak at 1309 cm− 1 is associated with the stretching vibration of C-O [36].
The surface chemical properties of CDs were further investigated using X-ray Photoelectron Spectroscopy (XPS). The full spectrum (Fig. S2) revealed three major peaks at 289.7, 399.2, and 531.7 eV, corresponding to the elements C, N, and O, respectively. The elemental composition of N-CDs was calculated to be 74.66% of C, 11.23% of N and 14.11% of O, respectively (Table S1). The high-resolution C1s spectrum (Fig. 2d) was deconvoluted into five peaks at 284.5, 285.6, 286.6, 287.9, and 289.8 eV, which correspond to C = C, C-N, C-O, C = N, and O-C-O functional groups, respectively [38, 39]. The O1s spectrum (Fig. 2e) displayed two peaks at 531.5 and 533.4 eV, attributed to O-H and C = O groups, respectively [40]. The N1s spectrum (Fig. 2f) revealed peaks at 400.2 eV and 401.5 eV, corresponding to C-N-C and C-NH2, bonds, respectively, indicative of pyrrole nitrogen and graphitic nitrogen [9]. The XPS findings are consistent with FT-IR spectroscopy results, under high-pressure and high-temperature conditions, the carboxyl groups of citric acid react with the amine groups of biuret through amide condensation, effectively incorporating nitrogen into CDs. In the doped system, the introduction of graphitic nitrogen induces a red shift in visible light absorption into the near-infrared spectral range. This red shift is attributed to the presence of graphitic nitrogen, which narrows the H-L gap, with the extent of the shift increasing with higher nitrogen doping concentrations [33]. Graphitic nitrogen doping creates mid-gap states within the original H-L gap of an undoped system, a result of excess electrons being donated into the unoccupied π* orbitals of the conjugated system [41]. The fluorescence properties of the graphitic nitrogen doped system exhibit a significant narrowing of the H-L gap, leading to a pronounced red-shifted emission compared to the undoped system [33]. The Raman spectra of N-CDs (Fig. S3) showed two broad peaks corresponding to the D band and G band at about 1350 cm− 1 and 1615 cm− 1, respectively. The relative intensities of the D band to the G band (ID/IG = 0.95) indicated a high carbon lattice structures in the N-CDs content.
The optical properties of the N-CDs were charaterized to evaluate their fluorescence performance. As shown in the UV-vis-NIR absorption spectrum (Fig. 2g), the N-CDs exhibited a broad absorption range from 400 nm to 2000 nm, with strong absorption in the NIR-II region, indicating their exceptional NIR light absorption capabilities. This superior NIR absorption is attributed to the high content of graphitic nitrogen doping [33]. UV-vis-NIR spectrum of the N-CDs in solution (Fig. S4) further corroborates their strong absorption in the NIR-II region. As shown in Fig. 2h, Under excitation at 565 nm, the N-CDs exhibited fluorescence emission with a peak at 660 nm (Fig. 2h), which lies within the NIR-I biological window, enabling deeper fluorescence penetration. The fluorescence decay curve of N-CDs (Fig. 2i) revealed a fluorescence lifetime of 37.72 ns. Furthermore, the emission intensity of N-CDs varied with the excitation wavelength (Fig. S5), demonstrating excitation-dependent emission behavior, likely due to the presence of multiple emission centers on the surface of the N-CDs [27].

(a) Transmission Electron Microscopy (TEM) image of N-CDs. (b) Particle size distribution curve for N-CDs. (c) Fourier Transform Infrared (FTIR) spectrum of N-CDs. (d–f) XPS spectra of N-CDs, C element (d), O element (e), N element (f). (g) UV-vis-NIR spectrum of N-CDs. (h) Fluorescence emission spectrum of N-CDs. (i) Fluorescence decay curve of N-CDs in aqueous solution
Photothermal performance
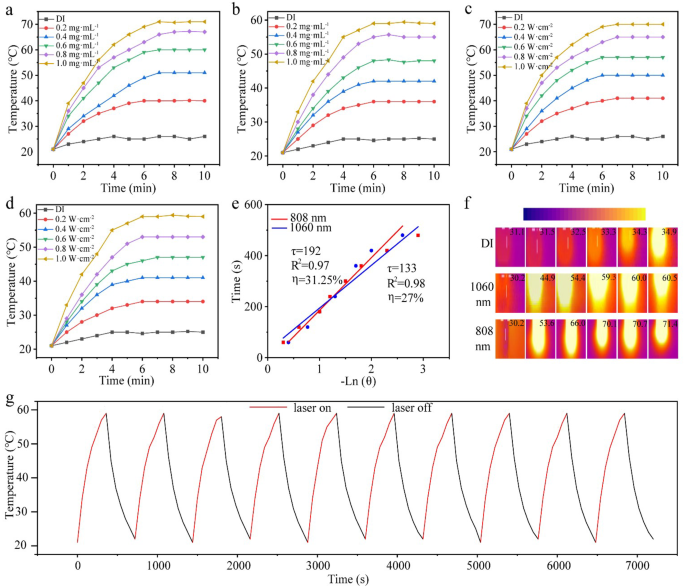
The UV-vis-NIR spectrum of the N-CDs revealed broad absorption peaks in both NIR-I and NIR-II regions, highlighting their potential as effective near-infrared photothermal agents. To evaluate their photothermal performance, laser sources at 808 nm and 1060 nm were employed. The study initially investigated the correlation between temperature rise and concentration of N-CDs under 808 nm and 1060 nm laser irradiation (1.0 W·cm− 2). As shown in Fig. 3a, DI water displayed a minimal temperature increase of only 5 ℃ under 808 nm irradiation. In contrast, a 0.2 mg·mL− 1 solution of N-CDs showed a temperature rise of 29 ℃, while solutions at 0.4 mg·mL− 1 and 0.6 mg·mL− 1 resulted in increases of 34 ℃ and 38 ℃, respectively. The highest concentrations, 0.8 mg·mL− 1 and 1.0 mg·mL− 1, exhibited temperature rises of 40 ℃ and 45 ℃, respectively. A similar trend was observed under 1060 nm laser irradiation (Fig. 3b), where DI water increased by only 9 ℃, while the 0.2 mg·mL− 1 N-CDs solution rose by 24 ℃. Solutions at concentrations of 0.4, 0.6, 0.8, and 1.0 mg·mL− 1 demonstrated temperature rises of 28 ℃, 32 ℃, 34 ℃, and 38 ℃, respectively. These results clearly demonstrate the concentration-dependent photothermal effect of N-CDs.
The relationship between the temperature rise of N-CDs (1.0 mg·mL− 1) and laser power at 808 nm and 1060 nm was also examined. As shown in Fig. 3c, under 808 nm laser irradiation, the temperature increases of 18 ℃, 21 ℃, 34 ℃, 38 ℃, and 43 ℃ were observed at power densities of 0.2, 0.4, 0.6, 0.8, and 1.0 W·cm− 2, respectively. Similarly, under 1060 nm laser irradiation (Fig. 3d), the temperature increases of 13 ℃, 19 ℃, 26 ℃, 33 ℃, and 39 ℃ were recorded at the same power densities. Additionally, based on the cooling phase data, the photothermal conversion efficiency of N-CDs was calculated to be 31.25% under 808 nm irradiation and 27.12% under 1060 nm irradiation (Fig. 3e). These values suggest that the N-CDs exhibit high photothermal conversion efficiency, making them highly effective as photothermal agents for therapeutic applications in tumor treatment under NIR light.
Moreover, Fig. 3f shows the infrared thermal imaging of the N-CDs solution (1.0 mg·mL− 1) under both 808 nm (1.0 W·cm− 2) and 1060 nm (1.0 W·cm− 2) laser illumination. Significant temperature increases were observed at each time interval (0, 2, 4, 6, 8, and 10 min), highlighting the exceptional photothermal efficiency of N-CDs. This efficiency can be attributed to several factors. Firstly, the amide condensation reaction between carboxyl and amine groups results in a nitrogen-rich surface, particularly the incorporation of graphitic nitrogen, which shifts the optical bandgap of N-CDs toward longer wavelengths [29]. Additionally, smaller nanoparticles exhibit higher light-to-heat conversion efficiency due to their increased surface area and reduced light scattering, minimizing energy loss during irradiation. Finally, the excellent solubility and dispersibility of N-CDs in water facilitate rapid heat transfer to the surrounding medium, further enhancing temperature rise [9].
Additionally, the photothermal stability of N-CDs was assessed through ten heating and cooling cycles. As shown in Fig. 3g and S6, the heating-cooling cycle tests demonstrated that the N-CDs maintained consistent photothermal performance across ten cycles under both 1060 nm and 808 nm illumination. No significant decline in photothermal performance was observed, confirming the excellent photothermal stability of N-CDs under NIR light exposure.
Moreover, the suspension stability of nanoparticles is determined by their Zeta potential. The Zeta potentials of N-CDs were measured to be -16.01 mV in DI, -30.53 mV in PBS, and − 26.79 mV in RPMI-1640 medium (Fig. S7). Nanoparticles with a higher surface charge, as indicated by Zeta potential, exhibit stronger repulsive force, leading to stable dispersion and retention [42].

(a–d) Photothermal heating curves of N-CDs, showing the effect of different concentrations (a–b), different powers (c–d). (e) Linear relationship between -lnθ and time. (f) Effect of heating of N-CDs under the thermal imaging camera. (g) Ten photothermal cycles of N-CDs (1.0 mg·mL− 1) under 1060 nm laser illumination (1.0 W·cm− 2)
Antibacterial of N-CDs
Given their strong photothermal effects in both the NIR-I and NIR-II regions, the near-infrared antibacterial capabilities of N-CDs were evaluated using Staphylococcus aureus as a model organism. The antibacterial performance was tested at various N-CDs concentrations (0.2, 0.4, 0.6, 0.8, and 1.0 mg·mL− 1) and different laser power densities (0.2, 0.4 0.6, 0.8, and 1.0 W·cm− 2). As shown in Fig. S8 a and b, at fixed laser power of 1.0 W·cm− 2 illumination, the number of bacterial colonies dramatically decreased as the concentration of the N-CDs solution increased, reaching maximum antibacterial efficiency of 95% and 90% at 808 and 1060 nm, respectively. Furthermore, the relationship between antibacterial efficacy and laser power was also studied. As depicted in Fig. S8 c and d, as the power increased to 1.0 W·cm− 2, the antibacterial efficiency reached 94% and 90% under 808 and 1060 nm irradiation, respectively. These results confirm that N-CDs effectively absorb NIR light and convert it into thermal energy, generating sufficient heat to inhibit or eliminate Staphylococcus aureus.
Cellular experiments
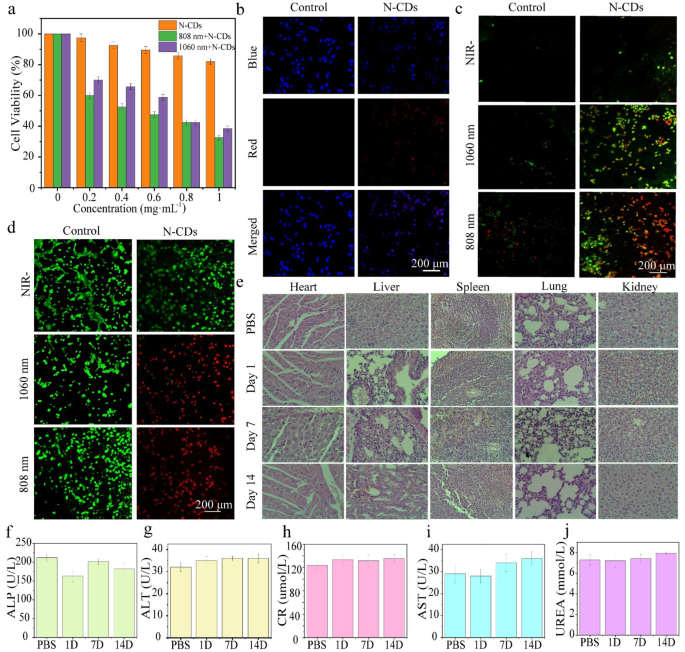
The PTT performance of N-CDs at the cellular level was evaluated using DU145 cells. Initially, the cytotoxicity of N-CDs was assessed using the MTT assay [9]. To avoid thermal damage to healthy tissues, the laser power density was maintained at 1.0 W·cm− 2 throughout the experiment. Notably, cell viability remained high even at a N-CDs concentration of 1.0 mg·mL− 1 without laser irradiation, indicating low intrinsic cytotoxicity (Fig. 4a). However, when subjected to 808–1060 nm lasers irradiation, cell viability decreased significantly. This suggests that N-CDs exhibit considerable phototoxicity under NIR light, attributed to their excellent photothermal conversion ability, underscoring their potential for effective photothermal therapy.
In addition, the cellular uptake ability of the N-CDs was evaluated using laser confocal scanning microscopy. As depicted in Fig. 4b, the extensive overlap between the blue fluorescence (DAPI-stained nuclei) and the red fluorescence (internalized N-CDs) strongly suggests that the N-CDs were efficiently internalized by the cells rather than merely adhering to their surface. This efficient internalization further highlights the significant potential of N-CDs in tumor-targeted therapies.
Annexin V-FITC and Propidium Iodide (PI) staining were utilized to assess cell apoptosis (Fig. 4c). Early apoptotic cells were identified by green fluorescence, while late apoptotic cells exhibited both green and red fluorescence. In the control group, minimal apoptosis was observed under all conditions. In contrast, the experimental group treated with N-CDs showed a marked increase in apoptosis upon laser exposure, with most cells displaying dual green and red fluorescence under both 808 nm and 1060 nm illumination. These results confirm the significant phototoxic effects of N-CDs on cells under NIR light exposure, highlighting their considerable potential for photothermal therapy applications.
The in vitro photothermal therapeutic efficacy of the N-CDs was further validated using a dual-staining experiment using Acridine Orange (AO) and Propidium Iodide (PI) dyes. In this assay, live cells were stained green by AO, while dead cells appeared red due to PI staining. As illustrated in Fig. 4d, the control group, treated with PBS, exhibited predominantly green fluorescence, indicating minimal cellular damage. In contrast, cells treated with N-CDs and exposed to the same conditions demonstrated pronounced red fluorescence at both 808 nm and 1060 nm wavelengths, indicting substantial cell death. These findings align with the results from the MTT assay, further confirming effective photothermal therapeutic potential of the N-CDs.
To further assess the long-term in vivo biocompatibility of N-CDs, healthy mice were administered a dose of 5.0 mg·kg− 1. Histological analysis of major organs (heart, lungs, kidneys, liver, and spleen) was conducted using H&E staining. The results indicted no significant adverse effects in mice treated with N-CDs solution over the first 14 days (Fig. 4e). Additionally, liver functional markers, including alanine aminotransferase (ALT), alkaline phosphatase (ALP), aspartate aminotransferase (AST), serum creatinine (CR), and urea (UREA) level, showed no notable differences between the control and experimental groups (Fig. 4f-j).
Furthermore, no significant changes in the body weight of the mice were observed during the treatment period (Fig. S9). The biocompatibility of N-CDs was further supported by coagulation tests (Fig. S10). Mouse blood exposed to PBS or the N-CDs solution maintained normal coagulation capability, whereas exposure to water resulted in hemolysis and loss of coagulation ability, highlighting the safe interaction between N-CDs and biological systems. Taken together, these findings provide compelling evidence that N-CDs exhibit high biocompatibility, making them suitable for PTT.

(a) Viability of DU145 cells incubated with solutions containing different concentrations of N-CDs under 808 nm and 1060 nm laser irradiation. (b) Uptake of N-CDs by DU145 cells incubated in PBS (control group) and N-CDs solution (experimental group). (c) Apoptosis imaging of DU145 cells incubated in PBS (control group) and N-CDs solution (experimental group) under dark conditions, with 1060 nm and 808 nm laser irradiation. (d) Live/dead imaging of DU145 cells incubated in PBS (control group) and N-CDs solution (experimental group) under dark conditions, with 1060 nm and 808 nm laser irradiation. (e) H&E staining of major organs (heart, lung, kidney, liver, and spleen) from healthy mice 1, 7, and 14 days after intravenous injection of PBS and N-CDs. (f)-(j) Values of major functional factors (alanine aminotransferase, ALT; alkaline phosphatase, ALP; aspartate aminotransferase, AST) in the liver, serum creatinine (CR), and urea (UREA) in healthy mice 1, 7, and 14 days after intravenous injection of PBS and N-CDs
Animal experiments
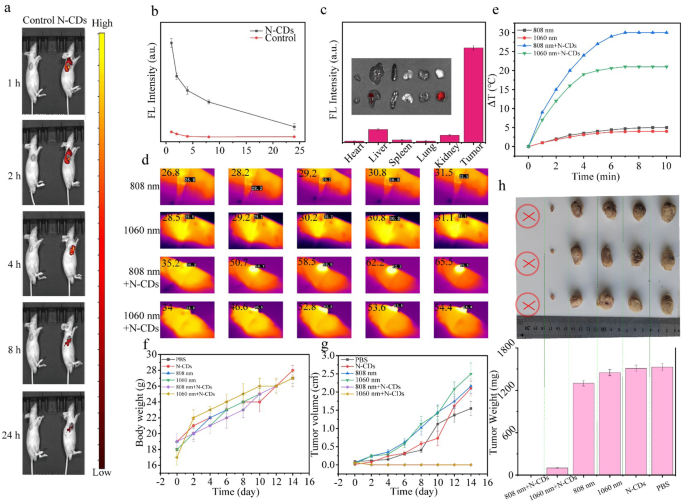
To assess the potential of N-CDs as a theranostic agent, their in vivo fluorescence imaging capabilities were further examined. Nude mice bearing subcutaneous DU145 tumors were selected as the animal model, and N-CDs were administered via intratumoral injection. As depicted in Fig. 5a and b, the fluorescence intensity at the tumor site progressively increased over time, peaking approximately 1 h post-injection before gradually declining. This indicates that the uptake of N-CDs by tumor cells reaches its maximum within 1 h. By 24 h, the fluorescence signal had nearly disappeared, suggesting that the N-CDs were extensively metabolized and cleared from the tumor site. Following intratumoral injection of N-CDs solution in mice, we performed quantitative analysis of fluorescence intensity in the tumor tissue. As shown in Table. S2, the fluorescence intensity of N-CDs reached 9.092 × 10⁷ at 1 h post-injection, which subsequently decreased to 1.39 × 10⁷ after 24 h, yielding a ratio of approximately 0.153. This indicates an 84.7% reduction of N-CDs at the tumor site within 24 h, demonstrating substantial metabolic clearance. The dose of N-CDs was calculated to be injected into the mouse, resulting in a total mass of 10 µg. After 24 h, the metabolic rate was 84.7%, thus, only 1.53 µg of N-CDs remained within the tumor of the mouse.
Additionally, to more precisely assess the biodistribution of N-CDs, the mice were humanely euthanized 24 h post-injection, and their major organs (heart, liver, spleen, lung, and kidney) as well as the tumor were collected for further analysis. The fluorescence images and quantified fluorescence intensity values of the excised tissues (Fig. 5c) revealed minimal signals in major organs, indicating efficient metabolism of N-CDs. Importantly, the fluorescence in the tissue samples was primarily within the 500–600 nm range. Notably, the red fluorescence emitted by N-CDs at 660 nm provides a significant advantage. This specific red emission effectively reduces interference from intrinsic tissue autofluorescence, positioning N-CDs as a highly promising candidate for live imaging applications.
Given the excellent photothermal properties and high biocompatibility of N-CDs, their in vivo antitumor performance was assessed under NIR irradiation (Fig. S11). Tumor-bearing mice were randomly divided into six groups and treated with PBS, N-CDs alone, 808 nm laser alone, 1060 nm laser alone, N-CDs + 808 nm laser, and N-CDs + 1060 nm laser, respectively. To minimize potential photodamage to healthy tissue, the laser power density was maintained at a relatively low of 1.0 W·cm− 2. The infrared thermograms and temperature changes at the tumor sites were monitored using an infrared camera. As shown in Fig. 5d and e, the N-CDs + 808 nm and N-CDs + 1060 nm groups exhibited a significant temperature increase at the tumor sites, while the groups receiving only laser irradiation (808–1060 nm) showed minimal temperature changes. After 4 min of irradiation, the tumor temperature in the N-CDs + 808 nm and N-CDs + 1060 nm groups rose from 35.2 °C to 58.5 °C and from 34.0 °C to 52.8 °C, respectively. In contrast, the 808 nm and 1060 nm control groups showed negligible temperature changes (approximately 4.7 °C and 2.6 °C, respectively). In addition, no significant fluctuations in body weight were observed during the 14-day treatment period (Fig. 5f), indicating that N-CDs cased minimal systemic side effects.
As shown in Fig. 5g and h, the tumors in N-CDs + 808 nm group were completely eradicated, while those in the N-CDs + 1060 nm group were nearly ablated. In contrast, tumors in control groups continued to grow rapidly, visually confirming the superior tumor growth inhibition in the N-CDs + 808 nm and N-CDs + 1060 nm treatments. Furthermore, no tumor recurrence was observed during the follow-up period, demonstrating the effectiveness of N-CDs in preventing tumor regrowth.
Subsequently, histological evolution of major organs (heart, lungs, kidneys, liver, and spleen) from the treated mice revealed no significant pathological changes in either the control or experimental groups. This finding further supports the safety profile of N-CDs for vivo applications (Fig. S12).
Furthermore, histological examination of tumor tissue sections from the treatment groups revealed pronounced signs of apoptosis and necrosis, whereas the control group exhibited no significant cellular damage (Fig. S13). These observations underscore the robust photothermal therapeutic efficacy of N-CDs, highlighting their potential as a promising and safe modality for cancer treatment.

(a) Fluorescence visualization of DU145 tumor-bearing nude mice subsequent to the administration of the injection of N-CDs at corresponding time points, with the red circle indicating the tumor area. (b) Fluorescence photographs of the major organs and tumor in DU145 tumor-bearing nude mice taken 24 h post-injection with N-CDs, along with the fluorescence intensities. (c) Fluorescence intensity values at the tumor site of Nude mice with DU145 tumors at various time intervals following the injection of N-CDs. (d) Infrared thermograms of the tumor sites in DU145 tumor-bearing nude mice from the control and experimental groups under 808–1060 nm (1.0 W·cm− 2) irradiation at different time intervals, and (e) the resultant temperature increase. (f) Weight change curves of tumor-bearing nude mice over 14 days under different treatments. (g) Tumor volume change curves of tumor-bearing nude mice over 14 days under different treatments. (h) Schematic illustrations of tumors in different groups of tumor-bearing nude mice after 14 days

