(Chuysang/Shutterstock)
In the world of monitoring software, how you process telemetry data can significantly impact your ability to derive insights, troubleshoot issues, and manage costs.
There are 2 primary use cases for how telemetry data is leveraged:
- Radar (Monitoring of systems) usually falls into the bucket of known knowns and known unknowns. This leads to scenarios where some data is almost ‘pre-determined’ to behave, be plotted in a certain way – because we know what we are looking for.
- Blackbox (Debugging, RCA etc.) ones on the other hand are more to do with unknown unknowns. Which entails to what we don’t know and may need to hunt for to build an understanding of the system.
Understanding Telemetry Data Challenges
Before diving into processing approaches, it’s important to understand the unique challenges of telemetry data:
- Volume: Modern systems generate enormous amounts of telemetry data
- Velocity: Data arrives in continuous, high-throughput streams
- Variety: Multiple formats across metrics, logs, traces, profiles and events
- Time-sensitivity: Value often decreases with age
- Correlation needs: Data from different sources must be linked together
These characteristics create special considerations when choosing between ETL and ELT approaches.
ETL for Telemetry: Transform-First Architecture
Technical Architecture
In an ETL approach, telemetry data undergoes transformation before reaching its final destination:

Fig. 1 — ETL for Telemetry
A typical implementation stack might include:
- Collection: OpenTelemetry, Prometheus, Fluent Bit
- Transport: Kafka or Kinesis or in memory as the buffering layer
- Transformation: Stream processing
- Storage: Time-series databases (Prometheus) or specialized indices or Object Storage (s3)
Key Technical Components
- Aggregation Techniques
Pre-aggregation significantly reduces data volume and query complexity. A typical pre-aggregation flow looks like this:

Fig. 2 — Aggregation Techniques
This transformation condenses raw data into 5-minute summaries, dramatically reducing storage requirements and improving query performance.
Example: For a gaming application handling millions of requests per day, raw request latency metrics (potentially billions of data points) can be grouped by service and endpoint, then aggregated into 5-minute (or 1-minute) windows. A single API call that generates 100 latency data points per second (8.64 million per day) is reduced to just 288 aggregated entries per day (one per 5-minute window), while still preserving critical p50/p90/p99 percentiles needed for SLA monitoring.
- Cardinality Management
High-cardinality metrics can break time-series databases. The cardinality management process follows this pattern:

Fig. 3 — Cardinality-Management
Effective strategies include:
- Label filtering and normalization
- Strategic aggregation of specific dimensions
- Hashing techniques for high-cardinality values while preserving query patterns
Example: A microservice tracking HTTP requests includes user IDs and request paths in its metrics. With 50,000 daily active users and thousands of unique URL paths, this creates millions of unique label combinations. The cardinality management system filters out user IDs entirely (configurable, too high cardinality), normalizes URL paths by replacing dynamic segments with placeholders (e.g., /users/123/profilebecomes /users/{id}/profile), and applies consistent categorization to errors. This reduces unique time series from millions to hundreds, allowing the time-series database to function efficiently.
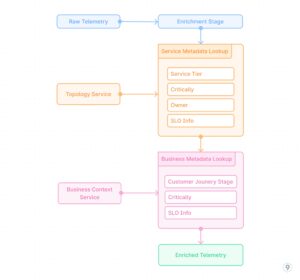
Fig. 4 — Real-time Enrichment
- Real-time Enrichment
Adding context to metrics during the transformation phase involves integrating external data sources:
This process adds critical business and operational context to raw telemetry data, enabling more meaningful analysis and alerting based on service importance, customer impact, and other factors beyond pure technical metrics.
Example: A payment processing service emits basic metrics like request counts, latencies, and error rates. The enrichment pipeline joins this telemetry with service registry data to add metadata about the service tier (critical), SLO targets (99.99% availability), and team ownership (payments-team). It then incorporates business context to tag transactions with their type (subscription renewal, one-time purchase, refund) and estimated revenue impact. When an incident occurs, alerts are automatically prioritized based on business impact rather than just technical severity, and routed to the appropriate team with rich context.
Technical Advantages
- Query performance: Pre-calculated aggregates eliminate computation at query time
- Predictable resource usage: Both storage and query compute are controlled
- Schema enforcement: Data conformity is guaranteed before storage
- Optimized storage formats: Data can be stored in formats optimized for specific access patterns
Technical Limitations
- Loss of granularity: Some detail is permanently lost
- Schema rigidity: Adapting to new requirements requires pipeline changes
- Processing overhead: Real-time transformation adds complexity and resource demands
- Transformation-time decisions: Analysis paths must be known in advance
ELT for Telemetry: Raw Storage with Flexible Transformation
Technical Architecture
ELT architecture prioritizes getting raw data into storage, with transformations performed at query time:

Fig. 5 — ELT for Telemetry
A typical implementation might include:
- Collection: OpenTelemetry, Prometheus, Fluent Bit
- Transport: Direct ingestion without complex processing
- Storage: Object storage (S3, GCS) or data lakes in Parquet format
- Transformation: SQL engines (Presto, Athena), Spark jobs, or specialized OLAP systems
Key Technical Components
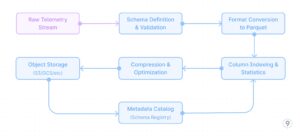
Fig. 6 — Efficient-Raw-Storage
- Efficient Raw Storage
Optimizing for long-term storage of raw telemetry requires careful consideration of file formats and storage organization:
This approach leverages columnar storage formats like Parquet with appropriate compression (ZSTD for traces, Snappy for metrics), dictionary encoding, and optimized column indexing based on common query patterns (trace_id, service, time ranges).
Example: A cloud-native application generates 10TB of trace data daily across its distributed services. Instead of discarding or heavily sampling this data, the complete trace information is captured using OpenTelemetry collectors and converted to Parquet format with ZSTD compression. Key fields like trace_id, service name, and timestamp are indexed for efficient querying. This approach reduces the storage footprint by 85% compared to raw JSON while maintaining query performance. When a critical customer-impacting issue occurred, engineers were able to access complete trace data from 3 months prior, identifying a subtle pattern of intermittent failures that would have been lost with traditional sampling.
- Partitioning Strategies
Effective partitioning is crucial for query performance against raw telemetry. A well-designed partitioning strategy follows this hierarchy:
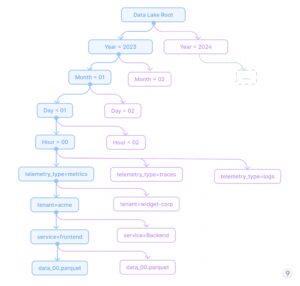
Fig. 7 — Partitioning-Strategies
This partitioning approach enables efficient time-range queries while also allowing filtering by service and tenant, which are common query dimensions. The partitioning strategy is designed to:
- Optimize for time-based retrieval (most common query pattern)
- Enable efficient tenant isolation for multi-tenant systems
- Allow service-specific queries without scanning all data
- Separate telemetry types for optimized storage formats per type
Example: A SaaS platform with 200+ enterprise customers uses this partitioning strategy for its observability data lake. When a high-priority customer reports an issue that occurred last Tuesday between 2-4pm, engineers can immediately query just those specific partitions: /year=2023/month=11/day=07/hour=1[4-5]/tenant=enterprise-x/*. This approach reduces the scan size from potentially petabytes to just a few gigabytes, enabling responses in seconds rather than hours. When comparing current performance against historical baselines, the time-based partitioning allows efficient month-over-month comparisons by scanning only the relevant time partitions.
- Query-time Transformations
SQL and analytical engines provide powerful query-time transformations. The query processing flow for on-the-fly analysis looks like this (See Fig. 8).
This query flow demonstrates how complex analysis like calculating service latency percentiles, error rates, and usage patterns can be performed entirely at query time without needing pre-computation. The analytical engine applies optimizations like predicate pushdown, parallel execution, and columnar processing to achieve reasonable performance even against large raw datasets.
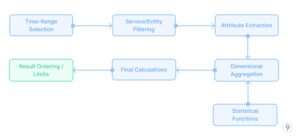
Fig. 8 — Query-time-Transformations
Example: A DevOps team investigating a performance regression discovered it only affected premium customers using a specific feature. Using query-time transformations against the ELT data lake, they wrote a single query that first filtered to the affected time period, joined customer tier information, extracted relevant attributes about feature usage, calculated percentile response times grouped by customer segment, and identified that premium customers with high transaction volumes were experiencing degraded performance only when a specific optional feature flag was enabled. This analysis would have been impossible with pre-aggregated data since the customer segment + feature flag dimension hadn’t been previously identified as important for monitoring.
Technical Advantages
- Schema flexibility: New dimensions can be analyzed without pipeline changes
- Cost-effective storage: Object storage is significantly cheaper than specialized DBs
- Retroactive analysis: Historical data can be examined with new perspectives
Technical Limitations
- Query performance challenges: Interactive analysis may be slow on large datasets
- Resource-intensive analysis: Compute costs can be high for complex queries
- Implementation complexity: Requires more sophisticated query tooling
- Storage overhead: Raw data consumes significantly more space
Technical Implementation: The Hybrid Approach
Core Architecture Components
Implementation Strategy
- Dual-path processing

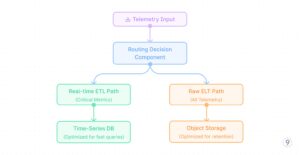
Fig. 10 — -Dual-path-processing
Example: A global ride-sharing platform implemented a dual-path telemetry system that routes service health metrics and customer experience indicators (ride wait times, ETA accuracy) through the ETL path for real-time dashboards and alerting. Meanwhile, all raw data including detailed user journeys, driver activities, and application logs flows through the ELT path to cost-effective storage. When a regional outage occurred, operations teams used the real-time dashboards to quickly identify and mitigate the immediate issue. Later, data scientists used the preserved raw data to perform a comprehensive root cause analysis, correlating multiple factors that wouldn’t have been visible in pre-aggregated data alone.
- Smart data routing
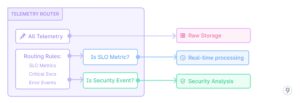
Fig. 11 — Smart Data Routing
Example: A financial services company deployed a smart routing system for their telemetry data. All data is preserved in the data lake, but critical metrics like transaction success rates, fraud detection signals, and authentication service health metrics are immediately routed to the real-time processing pipeline. Additionally, any security-related events such as failed login attempts, permission changes, or unusual access patterns are immediately sent to a dedicated security analysis pipeline. During a recent security incident, this routing enabled the security team to detect and respond to an unusual pattern of authentication attempts within minutes, while the complete context of user journeys and application behavior was preserved in the data lake for subsequent forensic analysis.
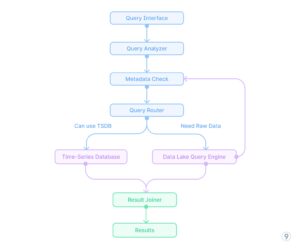
- Unified query interface
Real-world Implementation Example
A specific engineering implementation at last9.io demonstrates how this hybrid approach works in practice:
For a large-scale Kubernetes platform with hundreds of clusters and thousands of services, we implemented a hybrid telemetry pipeline with:
- Critical-path metrics processed through a pipeline that:

Fig. 12 — Unified query interface
-
- Performs dimensional reduction (limiting label combinations)
-
- Pre-calculates service-level aggregations
-
- Computes derived metrics like success rates and latency percentiles
- Raw telemetry stored in a cost-effective data lake:
-
- Partitioned by time, data type, and tenant
-
- Optimized for typical query patterns
-
- Compressed with appropriate codecs (Zstd for traces, Snappy for metrics)
- Unified query layer that:
-
- Routes dashboard and alerting queries to pre-aggregated storage
-
- Redirects exploratory and ad-hoc analysis to the data lake
-
- Manages correlation queries across both systems
This approach delivered both the query performance needed for real-time operations and the analytical depth required for complex troubleshooting.
Decision Framework
When architecting telemetry pipelines, these technical considerations should guide your approach:
| Decision Factor | Use ETL | Use ELT |
| Query latency requirements | < 1 second | Can wait minutes |
| Data retention needs | Days/Weeks | Months/Years |
| Cardinality | Low/Medium | Very high |
| Analysis patterns | Well-defined | Exploratory |
| Budget priority | Compute | Storage |
Conclusion
The technical realities of telemetry data processing demand thinking beyond simple ETL vs. ELT paradigms. Engineering teams should architect tiered systems that leverage the strengths of both approaches:
- ETL-processed data for operational use cases requiring immediate insights
- ELT-processed data for deeper analysis, troubleshooting, and historical patterns
- Metadata-driven routing to intelligently direct queries to the appropriate tier
This engineering-centric approach balances performance requirements with cost considerations while maintaining the flexibility required in modern observability systems.
About the author: Nishant Modak is the founder and CEO of Last9, a high cardinality observability platform company backed by Sequoia India (now PeakXV). He’s been an entrepreneur and working with large scale companies for nearly two decades.
Related Items:
From ETL to ELT: The Next Generation of Data Integration Success
Can We Stop Doing ETL Yet?
50 Years Of ETL: Can SQL For ETL Be Replaced?


